
One platform for roads, from the first survey to the last repair.
We start with road condition surveys from ordinary phone and dashcam video. Construction monitoring, DPR support and site intelligence for buildings and bridges follow, on the same maps and records.
Road condition and asset intelligence
Drive a road once with a phone or dashcam. The platform maps every visible defect and roadside asset by chainage, estimates the repair work and checks the repairs afterwards.
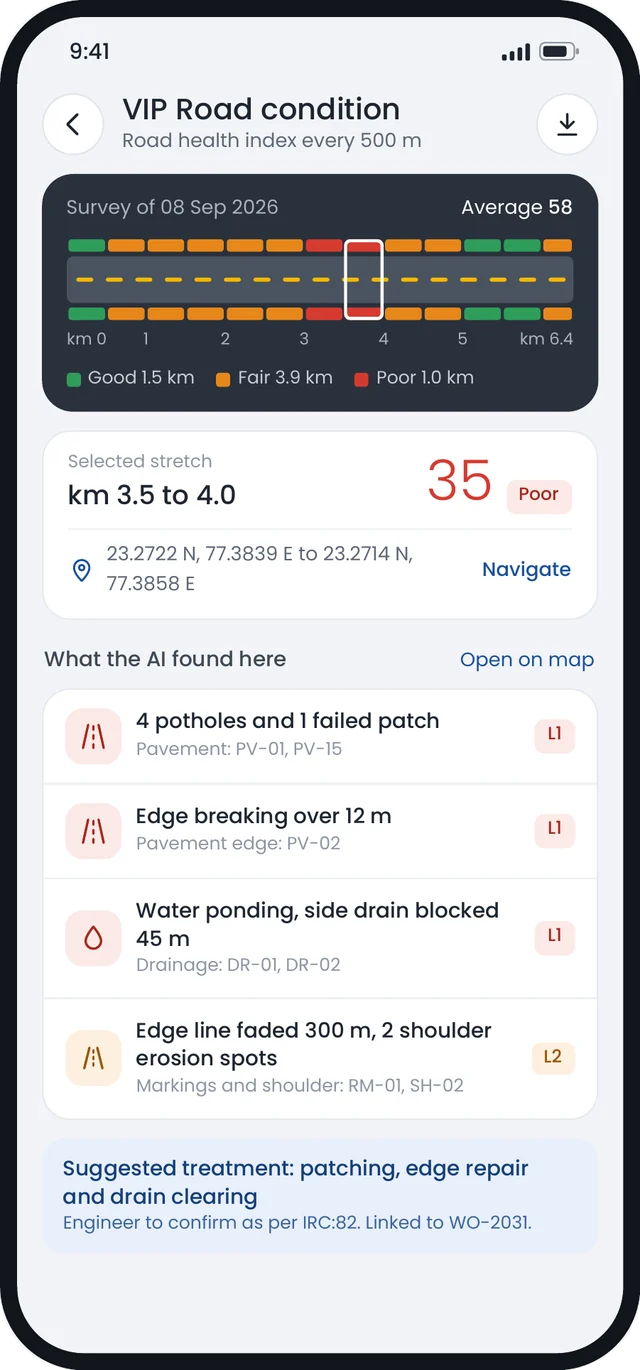
Condition assessment
AI detects and classifies visible surface defects, records their severity and location, and scores each road section by chainage.
- Potholes
- Cracks and surface distress
- Rutting and deformation
- Shoulder condition
- Damaged road surface
- Geotagged condition scoring
Repair estimation
The report lists mapped defects with estimated repair quantities by defect type, recommendations by location, indicative costs and a priority-based maintenance plan, for engineering review.
Before and after verification
Pre-repair video is compared with post-repair video to show whether each identified defect appears repaired, the extent of the repair and any defects that remain, with before and after images for each location.
Roadside asset inventory
- Road signs
- Road markings
- Guardrails and crash barriers
- Culverts and drainage
- Streetlights
- Trees and utilities
- Right-of-way condition
- Encroachments
How it works
Works with ordinary mobile phones as well as recommended dashcams.
Construction progress monitoring
Repeat drone surveys, planned at 15-day intervals, compare visible site changes with the approved programme. Where survey coverage and accuracy allow, the system estimates progress and flags locations for verification.
What is tracked
- Progress by chainage
- Progress by construction stage
- Earthwork, cutting and filling
- Bridges, culverts and structures
- Time-series comparison
- Photographic evidence
Construction stage recognition
The model classifies visible construction stages and estimates progress where the imagery supports reliable measurement. A typical flexible pavement sequence looks like this, though stages vary with each project's design:
GSB is granular sub-base. WMM is wet mix macadam. DBM is dense bituminous macadam. BC is bituminous concrete.
Levels, cut and fill, and deviation
Original ground level, survey data and the current surface are compared to estimate cut and fill quantities and deviation from design levels. Layer thickness needs suitable survey or field measurements alongside the imagery. Where confidence is low or deviation is significant, the system marks the location as Inspection Required.
Quality indicators
Visual and survey data can flag surface defects, uneven layers, unusual material appearance and other visible irregularities that may warrant further checks. Compaction compliance has to be established with the applicable field tests.
AI quality observations are risk indicators. They tell your team where to inspect. They do not replace laboratory or field testing.
Post-construction safety inventory
After construction, the platform maps visible road markings, signs, crash barriers and delineators, and flags apparent gaps against a specified checklist. The report supports inspection; it does not replace a formal road safety audit.
AI-assisted DPR preparation
Drone and LiDAR survey data is used to generate terrain models, longitudinal profiles, cross-sections and preliminary earthwork quantities for a road Detailed Project Report (DPR). Engineering design, further investigations and statutory approvals remain separate parts of the workflow.
Alignment intelligence
Identify and compare alternative alignments against terrain, settlements, existing roads and other constraints, then generate a preliminary alignment.
Standardised survey workflow
Automated engineering analysis
- Existing ground profile
- Longitudinal profile
- Cross-sections
- Preliminary cut, fill and earthwork quantities
- Indicative drainage requirements
- Likely culvert and bridge locations
DPR preparation workflow
Every stage passes through engineering review and approval. Traffic studies, geotechnical investigation, pavement and structural design, and statutory approvals remain part of the project workflow.
Site intelligence and digital twin
Site cameras and computer vision record visible construction activity and compare it with the project's BIM model. How much can be measured depends on camera coverage, model detail and the validation method used.
Observable site activity
- Material movement
- Labour and equipment activity
- Construction activities
- Work progress and productivity
- Safety observations
- Milestones reached
Digital twin
Site imagery and recorded progress are compared with the project BIM model to show visible differences between planned and observed work. How often it updates, and in how much detail, depends on camera coverage and the model available.
5D BIM progress
The 3D model, schedule, quantities and cost are linked to show planned against observed progress, estimated quantity completed, schedule deviation, delayed activities, work-package status and forecast completion.
Bridge stages
Shared data and mapping across all four modules.
All four modules use the same maps, chainage references and project records. Reusing data across projects depends on its format and on the access terms agreed with each client. Capabilities arrive with the module they belong to, so not every item below is available yet.
Data
AI
Intelligence
Access
Outputs
See what one drive finds on your road.
We will walk you through a sample survey, from the video to the final report. We can also check whether road video you already have can be used.